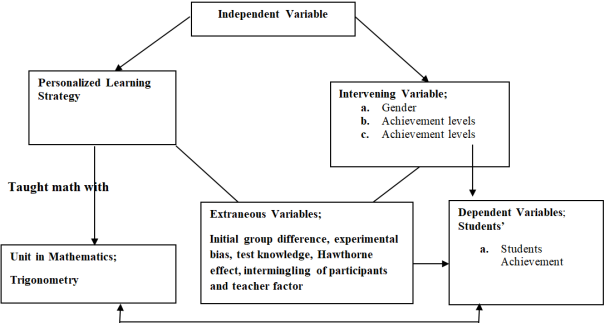
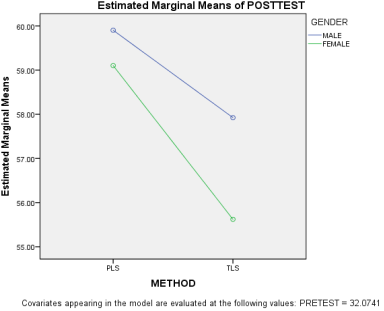
The main purpose of the study is to find out the effect of personalized learning strategy on the mathematics achievement of secondary school students. The design of the study is quasi-experimental, involving pre-test, post – test non randomized control group design. Hence, two intact classes were used (59 students for experimental group while 49 students for control group). The population of this study comprised of 5221 senior secondary one (SS1) student in public secondary schools within Okigwe education zone one of Imo State, Nigeria. The sample of this study comprised 108 senior secondary one (SS1) student using stratified random sampling techniques. Trigonometry Achievement Test (TAT) which was constructed by the researcher based on the topics chosen for the study, guided by the Table of Specification. The TAT instrument was used as pre-test and after the treatments, the same instrument was re-arranged and used as post-test. The instructional tool used for teaching the students was lesson plan and the Adaptive learning platform used for Personalized learning group. The Trigonometry Achievement Test (TAT) was face and content validated by experts. The reliability co-efficient values of 0.72 was gotten which was calculated using the Kuder – Richardson Formula 20. The research questions were answered using mean and standard deviation while ANCOVA was used to test the hypotheses. The findings revealed that significant difference exists between the achievement scores of students taught mathematics with Personalized learning strategy (PLS) and traditional learning strategy. There is no significant difference in the mean achievement scores of male and female students taught mathematics using PLS. Also, the findings revealed a significant difference in the mean achievement scores of high and low students taught mathematics using PLS. Based on the findings of the results, it was recommended that lack of professional development and the overall definition of personalized learning should be tackled, learners should be allowed to reach their individual goals based on their individual levels and that consistent support for the program from Government and education administrators.
| Published in | Education Journal (Volume 14, Issue 5) |
| DOI | 10.11648/j.edu.20251405.14 |
| Page(s) | 240-256 |
| Creative Commons |
This is an Open Access article, distributed under the terms of the Creative Commons Attribution 4.0 International License (http://creativecommons.org/licenses/by/4.0/), which permits unrestricted use, distribution and reproduction in any medium or format, provided the original work is properly cited. |
| Copyright |
Copyright © The Author(s), 2025. Published by Science Publishing Group |
Personalized Learning, Mathematics, Achievement, Gender and Achievement Levels
Group | N | Mean Pretest Score | SD Pretest Score | Mean Posttest Score | SD Posttest Score | Mean Gain Score |
|---|---|---|---|---|---|---|
PLS | 59 | 32.41 | 8.75 | 57.90 | 10.66 | 25.49 |
TLS | 49 | 31.67 | 9.45 | 50.37 | 12.05 | 18.70 |
Group | N | Mean Pre-test score | SD Pre-test score | Mean Posttest Score | SD Posttest Score | Mean Difference. |
|---|---|---|---|---|---|---|
PLS | ||||||
Male | 28 | 30.77 | 8.73 | 56.08 | 10.69 | |
3.08 | ||||||
Female | 31 | 33.29 | 9.40 | 53.00 | 12.79 |
Group PLS | N | Mean Pretest Score | SD Pretest Score | Mean Posttest Score | SD Posttest Score | Mean Difference |
|---|---|---|---|---|---|---|
High | 11 | 38.25 | 8.64 | 74.55 | 3.24 | |
29.22 | ||||||
Low | 15 | 28.60 | 8.18 | 45.33 | 6.17 |
Source | Type III Sum of Squares | Df | Mean Square | F | Sig. | Partial Eta Squared |
|---|---|---|---|---|---|---|
Corrected Model | 12781.544a | 12 | 1065.129 | 43.891 | .000 | .847 |
Intercept | 15888.456 | 1 | 15888.456 | 654.720 | .000 | .873 |
PRETEST | 114.588 | 1 | 114.588 | 4.722 | .032 | .047 |
METHOD | 125.267 | 1 | 125.267 | 5.162 | .025 | .052 |
GENDER | 39.375 | 1 | 39.375 | 1.623 | .206 | .017 |
ACHLEVEL | 6658.861 | 2 | 3329.431 | 137.197 | .000 | .743 |
Error | 2305.419 | 95 | 24.268 | |||
Total | 335656.000 | 108 | ||||
Corrected Total | 15086.963 | 107 |
PL | Personalize Learning |
PLS | Personalize Learning Strategy |
TLS | Traditional Learning Strategy |
TAT | Trigonometry Achievement Test |
S/N | Pretest | Posttest | Method | Gender | Ach. Lv |
|---|---|---|---|---|---|
1 | 40 | 72 | PLS | MALE | HIGH |
2 | 28 | 76 | PLS | MALE | HIGH |
3 | 20 | 80 | PLS | MALE | HIGH |
4 | 40 | 72 | PLS | MALE | HIGH |
5 | 28 | 76 | PLS | MALE | HIGH |
6 | 32 | 72 | PLS | MALE | HIGH |
7 | 40 | 80 | PLS | FEMALE | HIGH |
8 | 40 | 72 | PLS | FEMALE | HIGH |
9 | 40 | 72 | PLS | FEMALE | HIGH |
10 | 40 | 72 | PLS | FEMALE | HIGH |
11 | 48 | 76 | PLS | FEMALE | HIGH |
12 | 40 | 76 | TLS | MALE | HIGH |
13 | 40 | 72 | TLS | MALE | HIGH |
14 | 52 | 72 | TLS | FEMALE | HIGH |
15 | 32 | 76 | TLS | FEMALE | HIGH |
16 | 52 | 72 | TLS | FEMALE | HIGH |
17 | 40 | 56 | PLS | MALE | AVERAGE |
18 | 36 | 60 | PLS | MALE | AVERAGE |
19 | 20 | 64 | PLS | MALE | AVERAGE |
20 | 32 | 60 | PLS | MALE | AVERAGE |
21 | 16 | 64 | PLS | MALE | AVERAGE |
22 | 36 | 56 | PLS | MALE | AVERAGE |
23 | 28 | 52 | PLS | MALE | AVERAGE |
24 | 40 | 60 | PLS | MALE | AVERAGE |
25 | 28 | 64 | PLS | MALE | AVERAGE |
26 | 16 | 56 | PLS | MALE | AVERAGE |
27 | 32 | 52 | PLS | MALE | AVERAGE |
28 | 16 | 54 | PLS | MALE | AVERAGE |
29 | 40 | 52 | PLS | MALE | AVERAGE |
30 | 36 | 60 | PLS | MALE | AVERAGE |
31 | 40 | 54 | PLS | MALE | AVERAGE |
32 | 28 | 52 | PLS | MALE | AVERAGE |
33 | 24 | 60 | PLS | MALE | AVERAGE |
34 | 32 | 52 | PLS | MALE | AVERAGE |
35 | 32 | 56 | PLS | MALE | AVERAGE |
36 | 40 | 60 | PLS | MALE | AVERAGE |
37 | 40 | 56 | PLS | FEMALE | AVERAGE |
38 | 32 | 64 | PLS | FEMALE | AVERAGE |
39 | 40 | 64 | PLS | FEMALE | AVERAGE |
40 | 40 | 64 | PLS | FEMALE | AVERAGE |
41 | 40 | 60 | PLS | FEMALE | AVERAGE |
42 | 48 | 60 | PLS | FEMALE | AVERAGE |
43 | 32 | 56 | PLS | FEMALE | AVERAGE |
44 | 40 | 56 | PLS | FEMALE | AVERAGE |
45 | 44 | 60 | PLS | FEMALE | AVERAGE |
46 | 36 | 52 | PLS | FEMALE | AVERAGE |
47 | 44 | 60 | PLS | FEMALE | AVERAGE |
48 | 20 | 60 | PLS | FEMALE | AVERAGE |
49 | 24 | 60 | PLS | FEMALE | AVERAGE |
50 | 44 | 52 | TLS | MALE | AVERAGE |
51 | 20 | 64 | TLS | MALE | AVERAGE |
52 | 32 | 52 | TLS | MALE | AVERAGE |
53 | 28 | 52 | TLS | MALE | AVERAGE |
54 | 40 | 52 | TLS | MALE | AVERAGE |
55 | 40 | 64 | TLS | MALE | AVERAGE |
56 | 24 | 52 | TLS | MALE | AVERAGE |
57 | 48 | 64 | TLS | MALE | AVERAGE |
58 | 32 | 60 | TLS | MALE | AVERAGE |
59 | 40 | 60 | TLS | FEMALE | AVERAGE |
60 | 36 | 60 | TLS | FEMALE | AVERAGE |
61 | 20 | 52 | TLS | FEMALE | AVERAGE |
62 | 24 | 52 | TLS | FEMALE | AVERAGE |
63 | 32 | 52 | TLS | FEMALE | AVERAGE |
64 | 24 | 52 | TLS | FEMALE | AVERAGE |
65 | 44 | 60 | TLS | FEMALE | AVERAGE |
66 | 40 | 60 | TLS | FEMALE | AVERAGE |
67 | 32 | 40 | TLS | FEMALE | AVERAGE |
68 | 24 | 56 | TLS | FEMALE | AVERAGE |
69 | 24 | 56 | TLS | FEMALE | AVERAGE |
70 | 24 | 48 | PLS | MALE | LOW |
71 | 36 | 48 | PLS | MALE | LOW |
72 | 16 | 44 | PLS | MALE | LOW |
73 | 36 | 48 | PLS | FEMALE | LOW |
74 | 44 | 48 | PLS | FEMALE | LOW |
75 | 28 | 44 | PLS | FEMALE | LOW |
76 | 20 | 48 | PLS | FEMALE | LOW |
77 | 36 | 44 | PLS | FEMALE | LOW |
78 | 24 | 48 | PLS | FEMALE | LOW |
79 | 20 | 48 | PLS | FEMALE | LOW |
80 | 16 | 24 | PLS | FEMALE | LOW |
81 | 32 | 48 | PLS | FEMALE | LOW |
82 | 32 | 44 | PLS | FEMALE | LOW |
83 | 28 | 48 | PLS | FEMALE | LOW |
84 | 32 | 48 | PLS | FEMALE | LOW |
85 | 28 | 40 | TLS | MALE | LOW |
86 | 20 | 40 | TLS | MALE | LOW |
87 | 20 | 48 | TLS | MALE | LOW |
88 | 28 | 44 | TLS | MALE | LOW |
89 | 20 | 40 | TLS | MALE | LOW |
90 | 16 | 44 | TLS | MALE | LOW |
91 | 40 | 48 | TLS | MALE | LOW |
92 | 32 | 48 | TLS | MALE | LOW |
93 | 32 | 48 | TLS | MALE | LOW |
94 | 40 | 48 | TLS | MALE | LOW |
95 | 40 | 44 | TLS | MALE | LOW |
96 | 20 | 32 | TLS | MALE | LOW |
97 | 40 | 48 | TLS | FEMALE | LOW |
98 | 24 | 44 | TLS | FEMALE | LOW |
99 | 40 | 40 | TLS | FEMALE | LOW |
100 | 24 | 32 | TLS | FEMALE | LOW |
101 | 32 | 48 | TLS | FEMALE | LOW |
102 | 24 | 40 | TLS | FEMALE | LOW |
103 | 20 | 40 | TLS | FEMALE | LOW |
104 | 36 | 40 | TLS | FEMALE | LOW |
105 | 24 | 32 | TLS | FEMALE | LOW |
106 | 40 | 32 | TLS | FEMALE | LOW |
107 | 32 | 44 | TLS | FEMALE | LOW |
108 | 16 | 24 | TLS | FEMALE | LOW |
Method | Pretest | Posttest | |
|---|---|---|---|
PLS | Mean | 32.4068 | 57.8983 |
N | 59 | 59 | |
Std. Deviation | 8.74765 | 10.66366 | |
TLS | Mean | 31.6735 | 50.3673 |
N | 49 | 49 | |
Std. Deviation | 9.44587 | 12.05317 | |
Total | Mean | 32.0741 | 54.4815 |
N | 108 | 108 | |
Std. Deviation | 9.03545 | 11.87433 | |
Gender | Pretest | Posttest | |
|---|---|---|---|
MALE | Mean | 30.7692 | 56.0769 |
N | 52 | 52 | |
Std. Deviation | 8.73266 | 10.69331 | |
FEMALE | Mean | 33.2857 | 53.0000 |
N | 56 | 56 | |
Std. Deviation | 9.21997 | 12.79204 | |
Total | Mean | 32.0741 | 54.4815 |
N | 108 | 108 | |
Std. Deviation | 9.03545 | 11.87433 | |
ACHLEVEL | PRETEST | POSTTEST | |
|---|---|---|---|
HIGH | Mean | 38.2500 | 74.2500 |
N | 16 | 16 | |
Std. Deviation | 8.63713 | 2.90975 | |
AVERAGE | Mean | 32.8462 | 57.4615 |
N | 52 | 52 | |
Std. Deviation | 8.72541 | 4.39457 | |
LOW | Mean | 28.6000 | 42.7000 |
N | 40 | 40 | |
Std. Deviation | 8.18003 | 6.61854 | |
Total | Mean | 32.0741 | 54.4815 |
N | 108 | 108 | |
Std. Deviation | 9.03545 | 11.87433 | |
Value Label | N | ||
|---|---|---|---|
METHOD | 1.00 | PLS | 59 |
2.00 | TLS | 49 | |
GENDER | 4.00 | MALE | 52 |
5.00 | FEMALE | 56 | |
ACHLEVEL | 6.00 | HIGH | 16 |
7.00 | AVERAGE | 52 | |
8.00 | LOW | 40 | |
METHOD | GENDER | ACHLEVEL | Mean | Std. Deviation | N |
|---|---|---|---|---|---|
PLS | MALE | HIGH | 74.6667 | 3.26599 | 6 |
AVERAGE | 57.2000 | 4.27477 | 20 | ||
LOW | 46.6667 | 2.30940 | 3 | ||
Total | 59.7241 | 9.23849 | 29 | ||
FEMALE | HIGH | 74.4000 | 3.57771 | 5 | |
AVERAGE | 59.3846 | 3.59487 | 13 | ||
LOW | 45.0000 | 6.84902 | 12 | ||
Total | 56.1333 | 11.76709 | 30 | ||
Total | HIGH | 74.5455 | 3.23616 | 11 | |
AVERAGE | 58.0606 | 4.10746 | 33 | ||
LOW | 45.3333 | 6.17213 | 15 | ||
Total | 57.8983 | 10.66366 | 59 | ||
TLS | MALE | HIGH | 74.0000 | 2.82843 | 2 |
AVERAGE | 56.8889 | 5.92546 | 9 | ||
LOW | 43.6667 | 4.96045 | 12 | ||
Total | 51.4783 | 10.80770 | 23 | ||
FEMALE | HIGH | 73.3333 | 2.30940 | 3 | |
AVERAGE | 56.0000 | 3.77124 | 10 | ||
LOW | 38.7692 | 7.00183 | 13 | ||
Total | 49.3846 | 13.19114 | 26 | ||
Total | HIGH | 73.6000 | 2.19089 | 5 | |
AVERAGE | 56.4211 | 4.78790 | 19 | ||
LOW | 41.1200 | 6.48280 | 25 | ||
Total | 50.3673 | 12.05317 | 49 | ||
Total | MALE | HIGH | 74.5000 | 2.97610 | 8 |
AVERAGE | 57.1034 | 4.73848 | 29 | ||
LOW | 44.2667 | 4.65168 | 15 | ||
Total | 56.0769 | 10.69331 | 52 | ||
FEMALE | HIGH | 74.0000 | 3.02372 | 8 | |
AVERAGE | 57.9130 | 3.97621 | 23 | ||
LOW | 41.7600 | 7.49044 | 25 | ||
Total | 53.0000 | 12.79204 | 56 | ||
Total | HIGH | 74.2500 | 2.90975 | 16 | |
AVERAGE | 57.4615 | 4.39457 | 52 | ||
LOW | 42.7000 | 6.61854 | 40 | ||
Total | 54.4815 | 11.87433 | 108 |
Source | Type III Sum of Squares | df | Mean Square | F | Sig. | Partial Eta Squared |
|---|---|---|---|---|---|---|
Corrected Model | 12781.544a | 12 | 1065.129 | 43.891 | .000 | .847 |
Intercept | 15888.456 | 1 | 15888.456 | 654.720 | .000 | .873 |
PRETEST | 114.588 | 1 | 114.588 | 4.722 | .032 | .047 |
METHOD | 125.267 | 1 | 125.267 | 5.162 | .025 | .052 |
GENDER | 39.375 | 1 | 39.375 | 1.623 | .206 | .017 |
ACHLEVEL | 6658.861 | 2 | 3329.431 | 137.197 | .000 | .743 |
METHOD * GENDER | 9.404 | 1 | 9.404 | .388 | .535 | .004 |
METHOD * ACHLEVEL | 46.935 | 2 | 23.467 | .967 | .384 | .020 |
GENDER * ACHLEVEL | 73.230 | 2 | 36.615 | 1.509 | .226 | .031 |
METHOD * GENDER * ACHLEVEL | 5.769 | 2 | 2.884 | .119 | .888 | .002 |
Error | 2305.419 | 95 | 24.268 | |||
Total | 335656.000 | 108 | ||||
Corrected Total | 15086.963 | 107 |
Mean | Std. Error | 95% Confidence Interval | |
|---|---|---|---|
Lower Bound | Upper Bound | ||
58.137a | .604 | 56.939 | 59.336 |
Value Label | N | ||
|---|---|---|---|
METHOD | 1.00 | PLS | 59 |
GENDER | 4.00 | MALE | 29 |
5.00 | FEMALE | 30 | |
ACHLEVEL | 6.00 | HIGH | 11 |
7.00 | AVERAGE | 33 | |
8.00 | LOW | 15 | |
METHOD | GENDER | ACHLEVEL | Mean | Std. Deviation | N |
|---|---|---|---|---|---|
PLS | MALE | HIGH | 74.6667 | 3.26599 | 6 |
AVERAGE | 57.2000 | 4.27477 | 20 | ||
LOW | 46.6667 | 2.30940 | 3 | ||
Total | 59.7241 | 9.23849 | 29 | ||
FEMALE | HIGH | 74.4000 | 3.57771 | 5 | |
AVERAGE | 59.3846 | 3.59487 | 13 | ||
LOW | 45.0000 | 6.84902 | 12 | ||
Total | 56.1333 | 11.76709 | 30 | ||
Total | HIGH | 74.5455 | 3.23616 | 11 | |
AVERAGE | 58.0606 | 4.10746 | 33 | ||
LOW | 45.3333 | 6.17213 | 15 | ||
Total | 57.8983 | 10.66366 | 59 | ||
Total | MALE | HIGH | 74.6667 | 3.26599 | 6 |
AVERAGE | 57.2000 | 4.27477 | 20 | ||
LOW | 46.6667 | 2.30940 | 3 | ||
Total | 59.7241 | 9.23849 | 29 | ||
FEMALE | HIGH | 74.4000 | 3.57771 | 5 | |
AVERAGE | 59.3846 | 3.59487 | 13 | ||
LOW | 45.0000 | 6.84902 | 12 | ||
Total | 56.1333 | 11.76709 | 30 | ||
Total | HIGH | 74.5455 | 3.23616 | 11 | |
AVERAGE | 58.0606 | 4.10746 | 33 | ||
LOW | 45.3333 | 6.17213 | 15 | ||
Total | 57.8983 | 10.66366 | 59 |
Source | Type III Sum of Squares | df | Mean Square | F | Sig. | Partial Eta Squared |
|---|---|---|---|---|---|---|
Corrected Model | 5463.519a | 6 | 910.587 | 41.834 | .000 | .828 |
Intercept | 10297.263 | 1 | 10297.263 | 473.073 | .000 | .901 |
PRETEST | 1.606 | 1 | 1.606 | .074 | .787 | .001 |
METHOD | .000 | 0 | . | . | . | .000 |
GENDER | .035 | 1 | .035 | .002 | .968 | .000 |
ACHLEVEL | 3813.289 | 2 | 1906.644 | 87.594 | .000 | .771 |
METHOD * GENDER | .000 | 0 | . | . | . | .000 |
METHOD * ACHLEVEL | .000 | 0 | . | . | . | .000 |
GENDER * ACHLEVEL | 32.349 | 2 | 16.175 | .743 | .481 | .028 |
METHOD * GENDER * ACHLEVEL | .000 | 0 | . | . | . | .000 |
Error | 1131.870 | 52 | 21.767 | |||
Total | 204376.000 | 59 | ||||
Corrected Total | 6595.390 | 58 |
| [1] | Adeyemi, T. O. (2008). Predicting student's achievement in junior certificate examination in Ondo State, Nigeria. Humanity and social Sciences Journals, 3(1), 26-36. |
| [2] | Bray, B., & McClaskey, K. (2015). Personalized learning: A framework for implementation. International Center for Leadership in Education. |
| [3] | Darling – Harmmond, L (2009). Recognizing and enhancing teacher effectiveness. The International Journal of Education and Psychological Assessment, 3, 1-24. |
| [4] | Eze, C. G (2010). Integration of Geographic Information System in Planning and Management of Industrial Development in Nigeria, presented at the FIG Congress in Sygney from April 11-15, 2010. |
| [5] | Federal Republic of Nigeria (2013). National policy on education (5th ed.). Lagos: NERDC. |
| [6] | Ghazvini, S. D. and Khajehpour, M. (2011). Gender differences in factors affecting academic performance of high school students. Procedia - Social and Behavioral Sciences, 15: 1040-1045. |
| [7] | Griffin, C (2007). The theory and practice of learning. Baca Raton, FL: Taylor &Francis. |
| [8] | Khwaileh, F. and Zaza, H. (2010). Gender differences in academic performance among undergraduates at the University of Jordan: Are they real or stereotyping? College Student Journal, 45. |
| [9] | Koehler, M. J., & Mishra, P. (2009). What is technological pedagogical content knowledge? Contemporary Issues in Technology and Teacher Education, 9(1), 60-70. |
| [10] | Mankumari, P and Ajay, T (2017). Gender differences in the academic performance of students. Journal of Development and Social Engineering. 3 (1), 39-47. |
| [11] | Means, B., Toyama, Y., Murphy, R., & Bakia, M. (2010). Evaluation of evidence-based practices in online learning: A meta-analysis and review of online learning studies. |
| [12] | Nworgu, B. G. (2015). Educational research, basic issues and methodology (3rded.). Nsukka: University Trust Publishers. |
| [13] | OECD. (2019). PISA 2018 Results (Volume I): What Students Know and Can Do. PISA, OECD Publishing, Paris. |
| [14] | Ogoke, C. J, Anyanwu, A, Osuji, N (2018). Effect of immediate reinforcement learning strategy on the senior secondary school students’ achievement in mathematics. Journal of the Mathematical Association of Nigeria, 43(1), 202-209. |
| [15] | Ogoke, C. J. (2016). Effect of cooperative and competitive learning strategies on the achievement of secondary school students in mathematics. Unpublished master thesis, Nnamdi Azikiwe, Univeristy, Awka. Retrieved from: |
| [16] | Ohuche, S & Kurumeh, M. S (2011). Effect of two problems solving models on Junior secondary school students’ achievement on Algebra. Journal of Mathematics Education, 6(1), 38-35. |
| [17] | Okafor (2011). Effects of cooperative and individualized system of instruction on the senior secondary school students’ achievement in mathematics. Unpublished Doctorate Dissertation. NnamdiAzikiwe University, Awka. Retrieved from: |
| [18] | Okigbo, E. O. (2010). Comparative effectiveness of mathematical game and instructional analogy as advance organizers on students’ achievement and interest in mathematics. Unpublished Doctorate dissertations, Nnamdi Azikiwe University, Awka. Retrieved from: http://www.naulibrary.org |
| [19] | Onwukwe, E. O. (2014). Incorporation science drama into secondary school science lesson. Chemistry, owerri: Joe Mankpa publishers. |
| [20] | Orabi, I. (2007). Gender differences in student academic performance and attitudes. American Society for Engineering Education (Available at https://peer.asee.org/gender-differences-instudent-academic-performance-andattitudes. pdf) (March, 2010). |
| [21] | Pane, J. F., Steiner, E. D., Baird, M. D., & Hamilton, L. S. (2014). Continued progress: Promising evidence on personalized learning. RAND Corporation. |
| [22] | Sereno, M. (2017). The impact of a personalized learning framework on student achievement (Publication No. 10975724) [Doctoral dissertation, Edgewood College]. ProQuest Dissertation Publishing. |
| [23] | Shafi, A (2010). The Effect of Improvised Instructional Materials on Students’ Performance in Solid Geometry. ABACUS. The Journal of the Mathematical Association of Nigeria, 35 (1), 46-52. |
| [24] | WAEC Chief Examiner’s Report (2021). Annual Reports. Retrieved from: |
| [25] | Vygotsky, L. S. (1978). Mind in society. The development of higher psychological processes. |
| [26] | Wangu, M. J. (2014). The impact of gender differences on student’s academic performance in secondary schools in Ndumberi division, Kiambu County, Kenya in science subjects and languages. A Research Project Submitted in Partial Fulfillment of the Requirement for the Award of the Postgraduate Diploma in Education of University of Nairobi. |
| [27] | Whitney, K. (2021). The effect of personalized learning on student achievement (Publication No. 28320776). Doctoral dissertation, Regent University. ProQuest Dissertations Publishing. |
APA Style
James, O. C., Uchenna, O. T., Anthony, A. (2025). Effect of Personalized Learning Strategy on Senior Secondary School Students’ Achievement in Mathematics. Education Journal, 14(5), 240-256. https://doi.org/10.11648/j.edu.20251405.14
ACS Style
James, O. C.; Uchenna, O. T.; Anthony, A. Effect of Personalized Learning Strategy on Senior Secondary School Students’ Achievement in Mathematics. Educ. J. 2025, 14(5), 240-256. doi: 10.11648/j.edu.20251405.14
@article{10.11648/j.edu.20251405.14,
  author = {Ogoke Chinemeze James and Otumegwu Tina Uchenna and Anyanwu Anthony},
  title = {Effect of Personalized Learning Strategy on Senior Secondary School Students’ Achievement in Mathematics
},
  journal = {Education Journal},
  volume = {14},
  number = {5},
  pages = {240-256},
  doi = {10.11648/j.edu.20251405.14},
  url = {https://doi.org/10.11648/j.edu.20251405.14},
  eprint = {https://article.sciencepublishinggroup.com/pdf/10.11648.j.edu.20251405.14},
  abstract = {The main purpose of the study is to find out the effect of personalized learning strategy on the mathematics achievement of secondary school students. The design of the study is quasi-experimental, involving pre-test, post – test non randomized control group design. Hence, two intact classes were used (59 students for experimental group while 49 students for control group). The population of this study comprised of 5221 senior secondary one (SS1) student in public secondary schools within Okigwe education zone one of Imo State, Nigeria. The sample of this study comprised 108 senior secondary one (SS1) student using stratified random sampling techniques. Trigonometry Achievement Test (TAT) which was constructed by the researcher based on the topics chosen for the study, guided by the Table of Specification. The TAT instrument was used as pre-test and after the treatments, the same instrument was re-arranged and used as post-test. The instructional tool used for teaching the students was lesson plan and the Adaptive learning platform used for Personalized learning group. The Trigonometry Achievement Test (TAT) was face and content validated by experts. The reliability co-efficient values of 0.72 was gotten which was calculated using the Kuder – Richardson Formula 20. The research questions were answered using mean and standard deviation while ANCOVA was used to test the hypotheses. The findings revealed that significant difference exists between the achievement scores of students taught mathematics with Personalized learning strategy (PLS) and traditional learning strategy. There is no significant difference in the mean achievement scores of male and female students taught mathematics using PLS. Also, the findings revealed a significant difference in the mean achievement scores of high and low students taught mathematics using PLS. Based on the findings of the results, it was recommended that lack of professional development and the overall definition of personalized learning should be tackled, learners should be allowed to reach their individual goals based on their individual levels and that consistent support for the program from Government and education administrators.
},
 year = {2025}
}
TY  - JOUR
T1  - Effect of Personalized Learning Strategy on Senior Secondary School Students’ Achievement in Mathematics

AU  - Ogoke Chinemeze James
AU  - Otumegwu Tina Uchenna
AU  - Anyanwu Anthony
Y1  - 2025/10/17
PY  - 2025
N1  - https://doi.org/10.11648/j.edu.20251405.14
DO  - 10.11648/j.edu.20251405.14
T2  - Education Journal
JF  - Education Journal
JO  - Education Journal
SP  - 240
EP  - 256
PB  - Science Publishing Group
SN  - 2327-2619
UR  - https://doi.org/10.11648/j.edu.20251405.14
AB  - The main purpose of the study is to find out the effect of personalized learning strategy on the mathematics achievement of secondary school students. The design of the study is quasi-experimental, involving pre-test, post – test non randomized control group design. Hence, two intact classes were used (59 students for experimental group while 49 students for control group). The population of this study comprised of 5221 senior secondary one (SS1) student in public secondary schools within Okigwe education zone one of Imo State, Nigeria. The sample of this study comprised 108 senior secondary one (SS1) student using stratified random sampling techniques. Trigonometry Achievement Test (TAT) which was constructed by the researcher based on the topics chosen for the study, guided by the Table of Specification. The TAT instrument was used as pre-test and after the treatments, the same instrument was re-arranged and used as post-test. The instructional tool used for teaching the students was lesson plan and the Adaptive learning platform used for Personalized learning group. The Trigonometry Achievement Test (TAT) was face and content validated by experts. The reliability co-efficient values of 0.72 was gotten which was calculated using the Kuder – Richardson Formula 20. The research questions were answered using mean and standard deviation while ANCOVA was used to test the hypotheses. The findings revealed that significant difference exists between the achievement scores of students taught mathematics with Personalized learning strategy (PLS) and traditional learning strategy. There is no significant difference in the mean achievement scores of male and female students taught mathematics using PLS. Also, the findings revealed a significant difference in the mean achievement scores of high and low students taught mathematics using PLS. Based on the findings of the results, it was recommended that lack of professional development and the overall definition of personalized learning should be tackled, learners should be allowed to reach their individual goals based on their individual levels and that consistent support for the program from Government and education administrators.

VL  - 14
IS  - 5
ER  -
Department of Mathematics, Alvan Ikoku Federal University of Education, Owerri, Nigeria
Department of Educational Psychology, Federal College of Education (Technical), Omoku, Nigeria
Department of Mathematics, Alvan Ikoku Federal University of Education, Owerri, Nigeria